Rebuilding Custom Reports at Sprout Social
Redesigning a foundational analytics experience for thousands of enterprise customers
Context & Background
Sprout Social's Custom Reports are the most heavily used features in our Premium Analytics Add-On. It allows social media managers, agency customers, and analysts to assemble reports from a library of over 140 widgets used to analyze performance and share results with stakeholders.
The problem was that the previous iteration had reached the limits of its own architecture and we needed to refactor the entire system.
The Problem
Custom Reports used a report-level filtering model. When a user set a filter (for example, narrowing to a specific set of social profiles or tags) it applied to every widget in the report uniformly. There was no way to scope a filter to a single widget.
This meant something that should have been simple required building separate reports. Customers who managed campaigns across multiple brands, or who needed to tell a nuanced story about different segments of their social presence, were hitting a wall.
The existing filter system also persisted at the user level rather than the report level. Two people looking at the same report could be seeing completely different data depending on their individual filter settings, with no awareness of the discrepancy. For a tool whose primary purpose was shared storytelling, this was a fundamental misalignment.
The existing codebase had accumulated enough technical debt that its own internal documentation stated widget-level filtering was not intended to be supported within the current structure.
Discovery
Surveys
We sent a survey to our customers to understand how they used Custom Reports and what their unmet needs were.
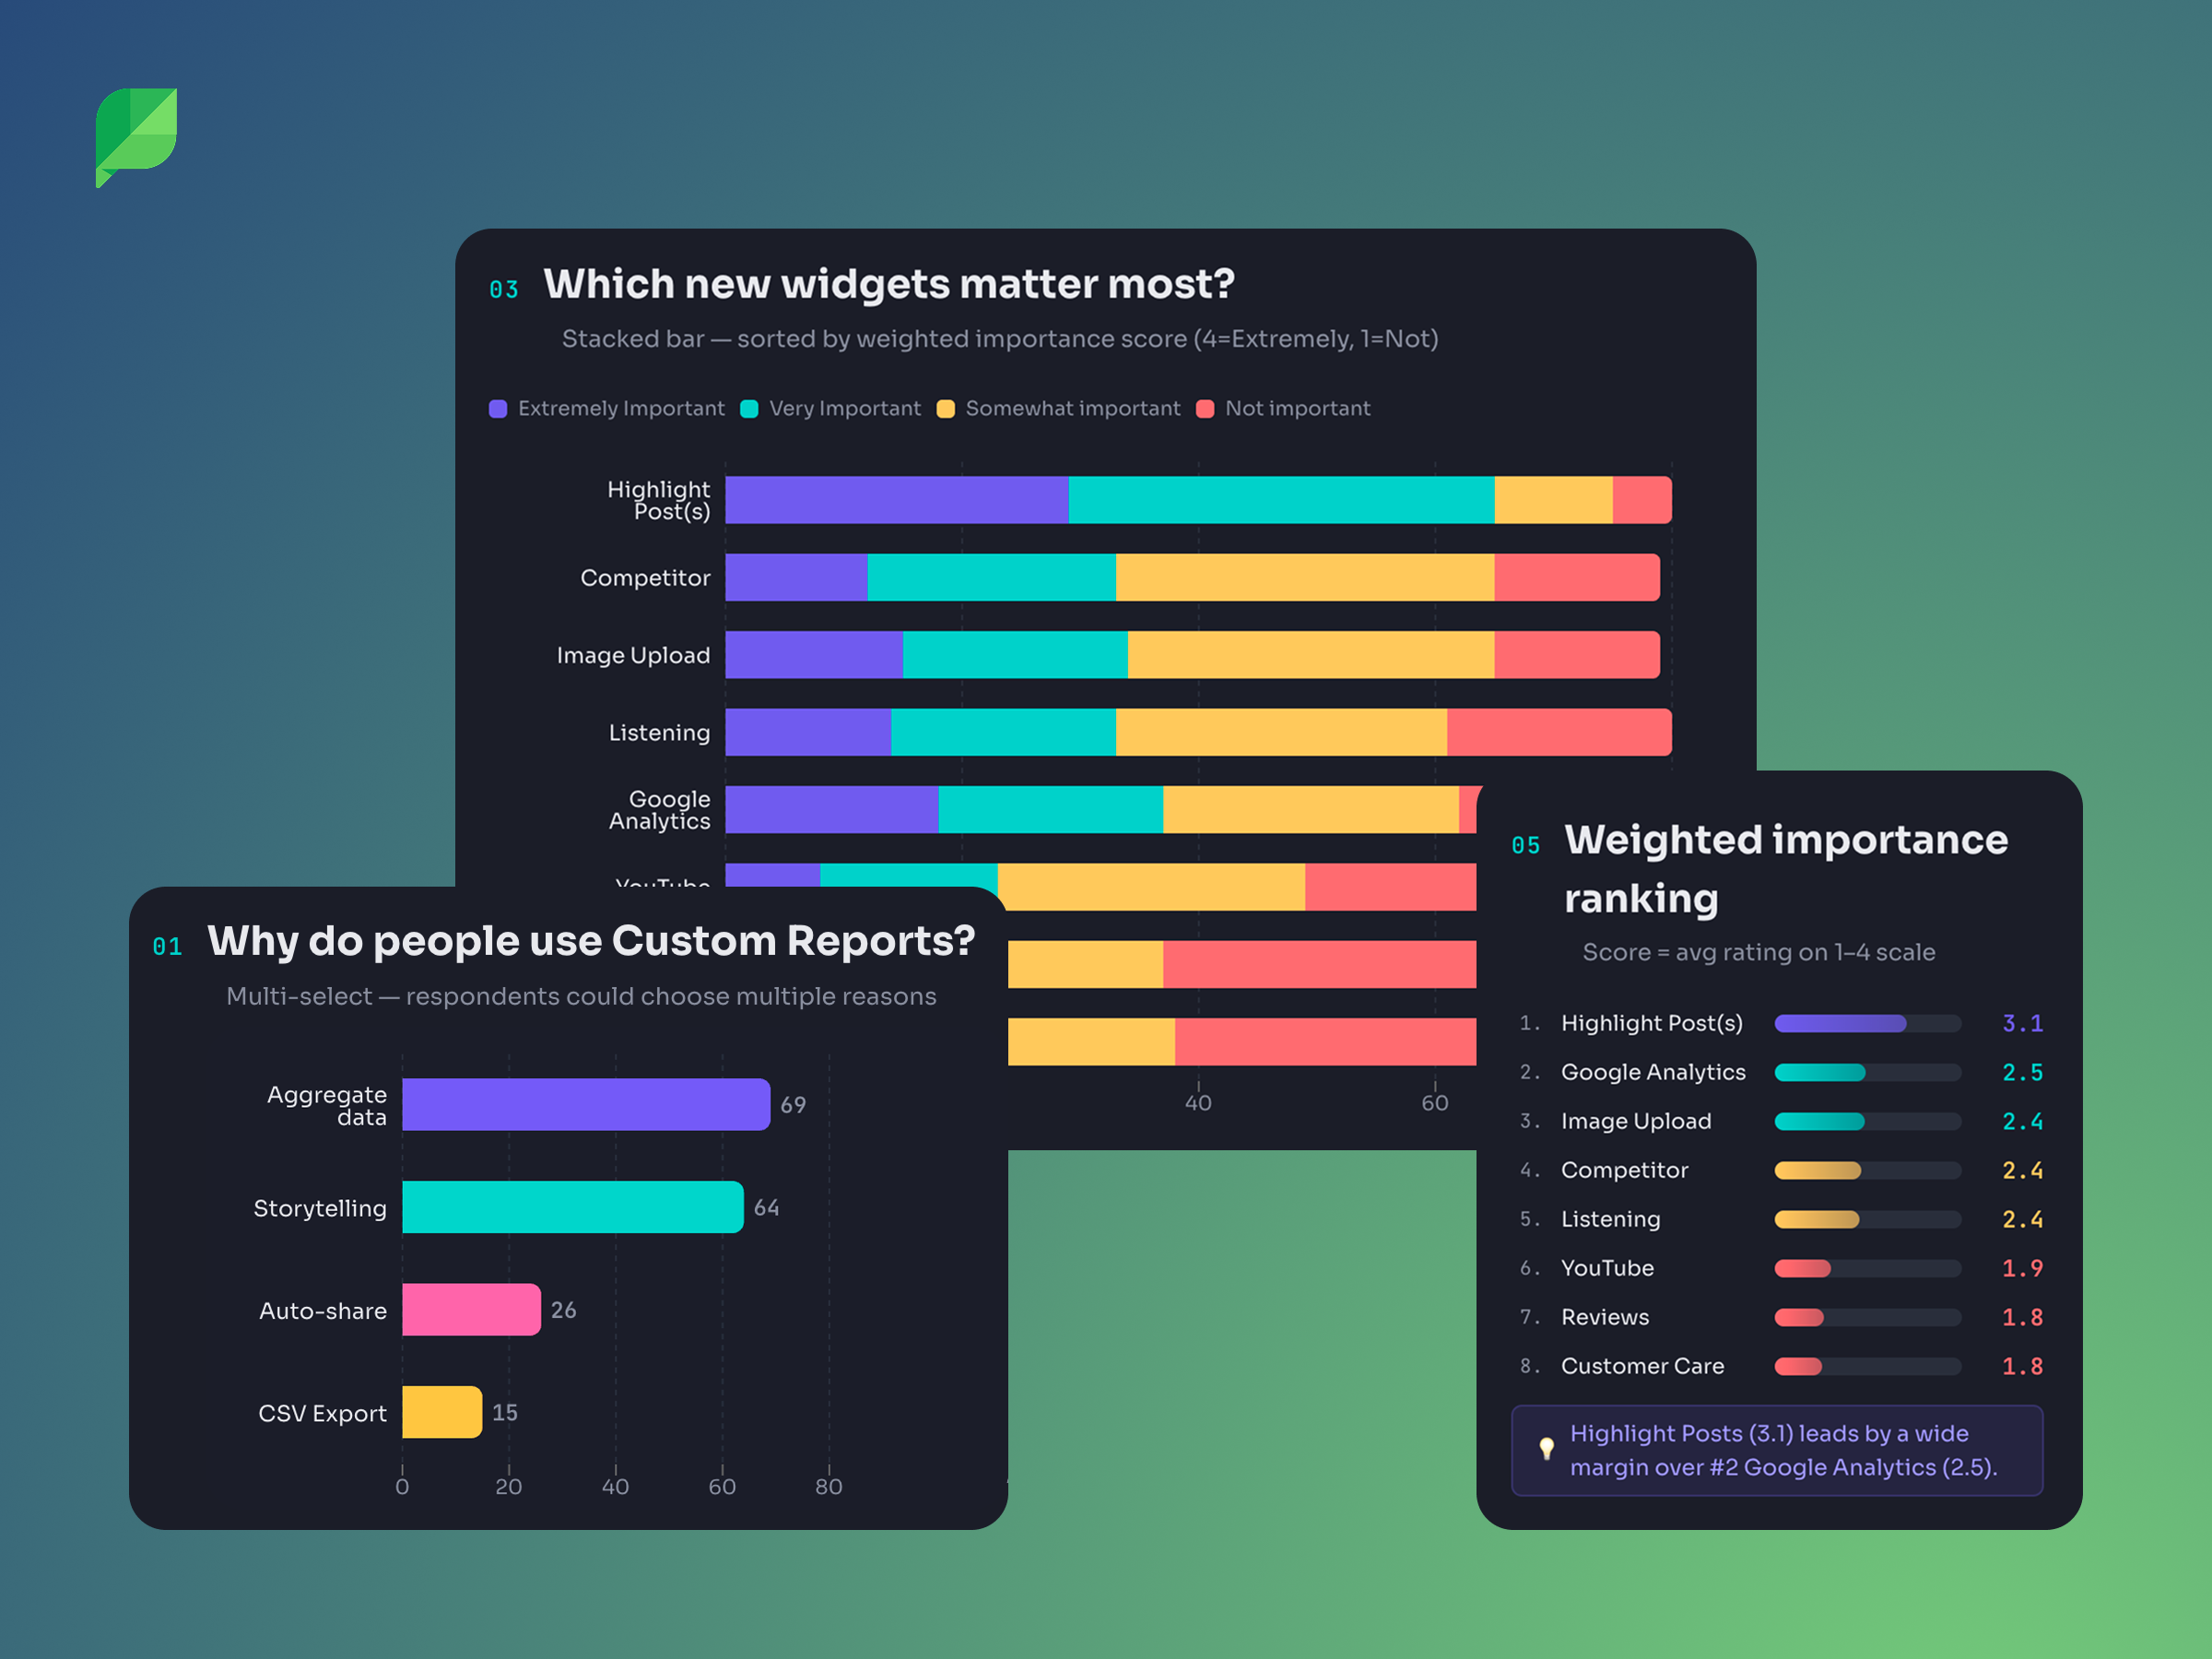
In the response, threee quarters identified widget-level filtering as one of their top five most critical enhancements. It tied for first place with report formatting improvements (tabs, sections, titles, etc). Drag-and-drop reordering came in third at 58%.
When asked why they used Custom Reports, the top two responses were aggregating disparate data to inform decision-making and simplifying the process of storytelling for stakeholders. The tool was as much about communication as analysis. This understanding would directly influence design decisions around annotations and report structure later.
Interviews
We conducted 12 interviews across internal stakeholders (Solutions Engineers, Customer Success Managers, social media strategists) and external customers (including a session with the Customer Advisory Board). Several patterns emerged that shaped the direction:
1. Filtering needs were not binary. Some users needed to filter a single widget to a specific campaign. Others needed to apply a profile filter across every widget in the report. Agencies managing dozens of clients needed to both apply broadly and also refine locally. This insight would directly inform the bulk filtering feature that shipped later, and it challenged an early assumption that widget-level filtering would simply replace report-level filtering.
2. Annotations were a critical gap. Across nearly every interview, customers described workarounds for adding context to their reports. They would often screenshot charts and paste them into their own slide decks, or write separate email summaries to accompany shared report links. The reports contained the data, but they couldn't carry the narrative. One internal strategist described how their team would "screenshot the listening data and drop it in an email" because there was no way to annotate or provide context within the report itself.
3. Social sophistication varied dramatically. Enterprise customers with dedicated analysts wanted deep customization and cross-network comparisons. Mid-market teams were excited simply by the prospect of seeing top posts from three networks in one view. This range meant the new system needed to be powerful without being intimidating. What we were building needed to be a flexible experience that could scale from simple to complex based on how much a user chose to configure.
4. Templates and education would be critical. Many customers didn't know what should go in a custom report. Several had created their own informal templates by duplicating a base report each month. The migration from one system to another would need to account for users who were still building comfort with the existing tool.
Defining the Approach
Working closely with the PM, we evaluated two paths:
Option 1: Update the existing Custom Report Builder in-place by remove report-level filters, and adding widget-level filters to all 140+ current widgets.
Option 2: Build a new version alongside the existing one, with consolidated widgets and widget-level filters baked in from the start.
We recommended Option 2, and it was the approach we moved forward with. The reasoning was grounded in both user experience and technical reality.
The existing system had over 140 widgets that would each need to be individually retrofitted. Releasing that all at once would mean users woke up one day to a fundamentally different filtering model with no transition period.
Building new alongside old let us do several things simultaneously: introduce widget-level filtering on a modern foundation, consolidate 140+ redundant widgets down to approximately 30 without reducing functionality, eliminate the edit/save mode that forced users into a separate state to make changes, and shift filter persistence from user-scoped to report-scoped so that shared reports would reflect the creator's intent consistently.
It also gave us a safe migration path. Users could adopt the new experience when they were ready, rather than having it forced on them overnight.
Designing the System
The Universal Configuration Pattern
We need a single pattern to support a different combination of filters, configurations, and visualizations. A Performance Summary widget has different filter options than a Engagement Rate widget, and both differ from a Post Performance widget.
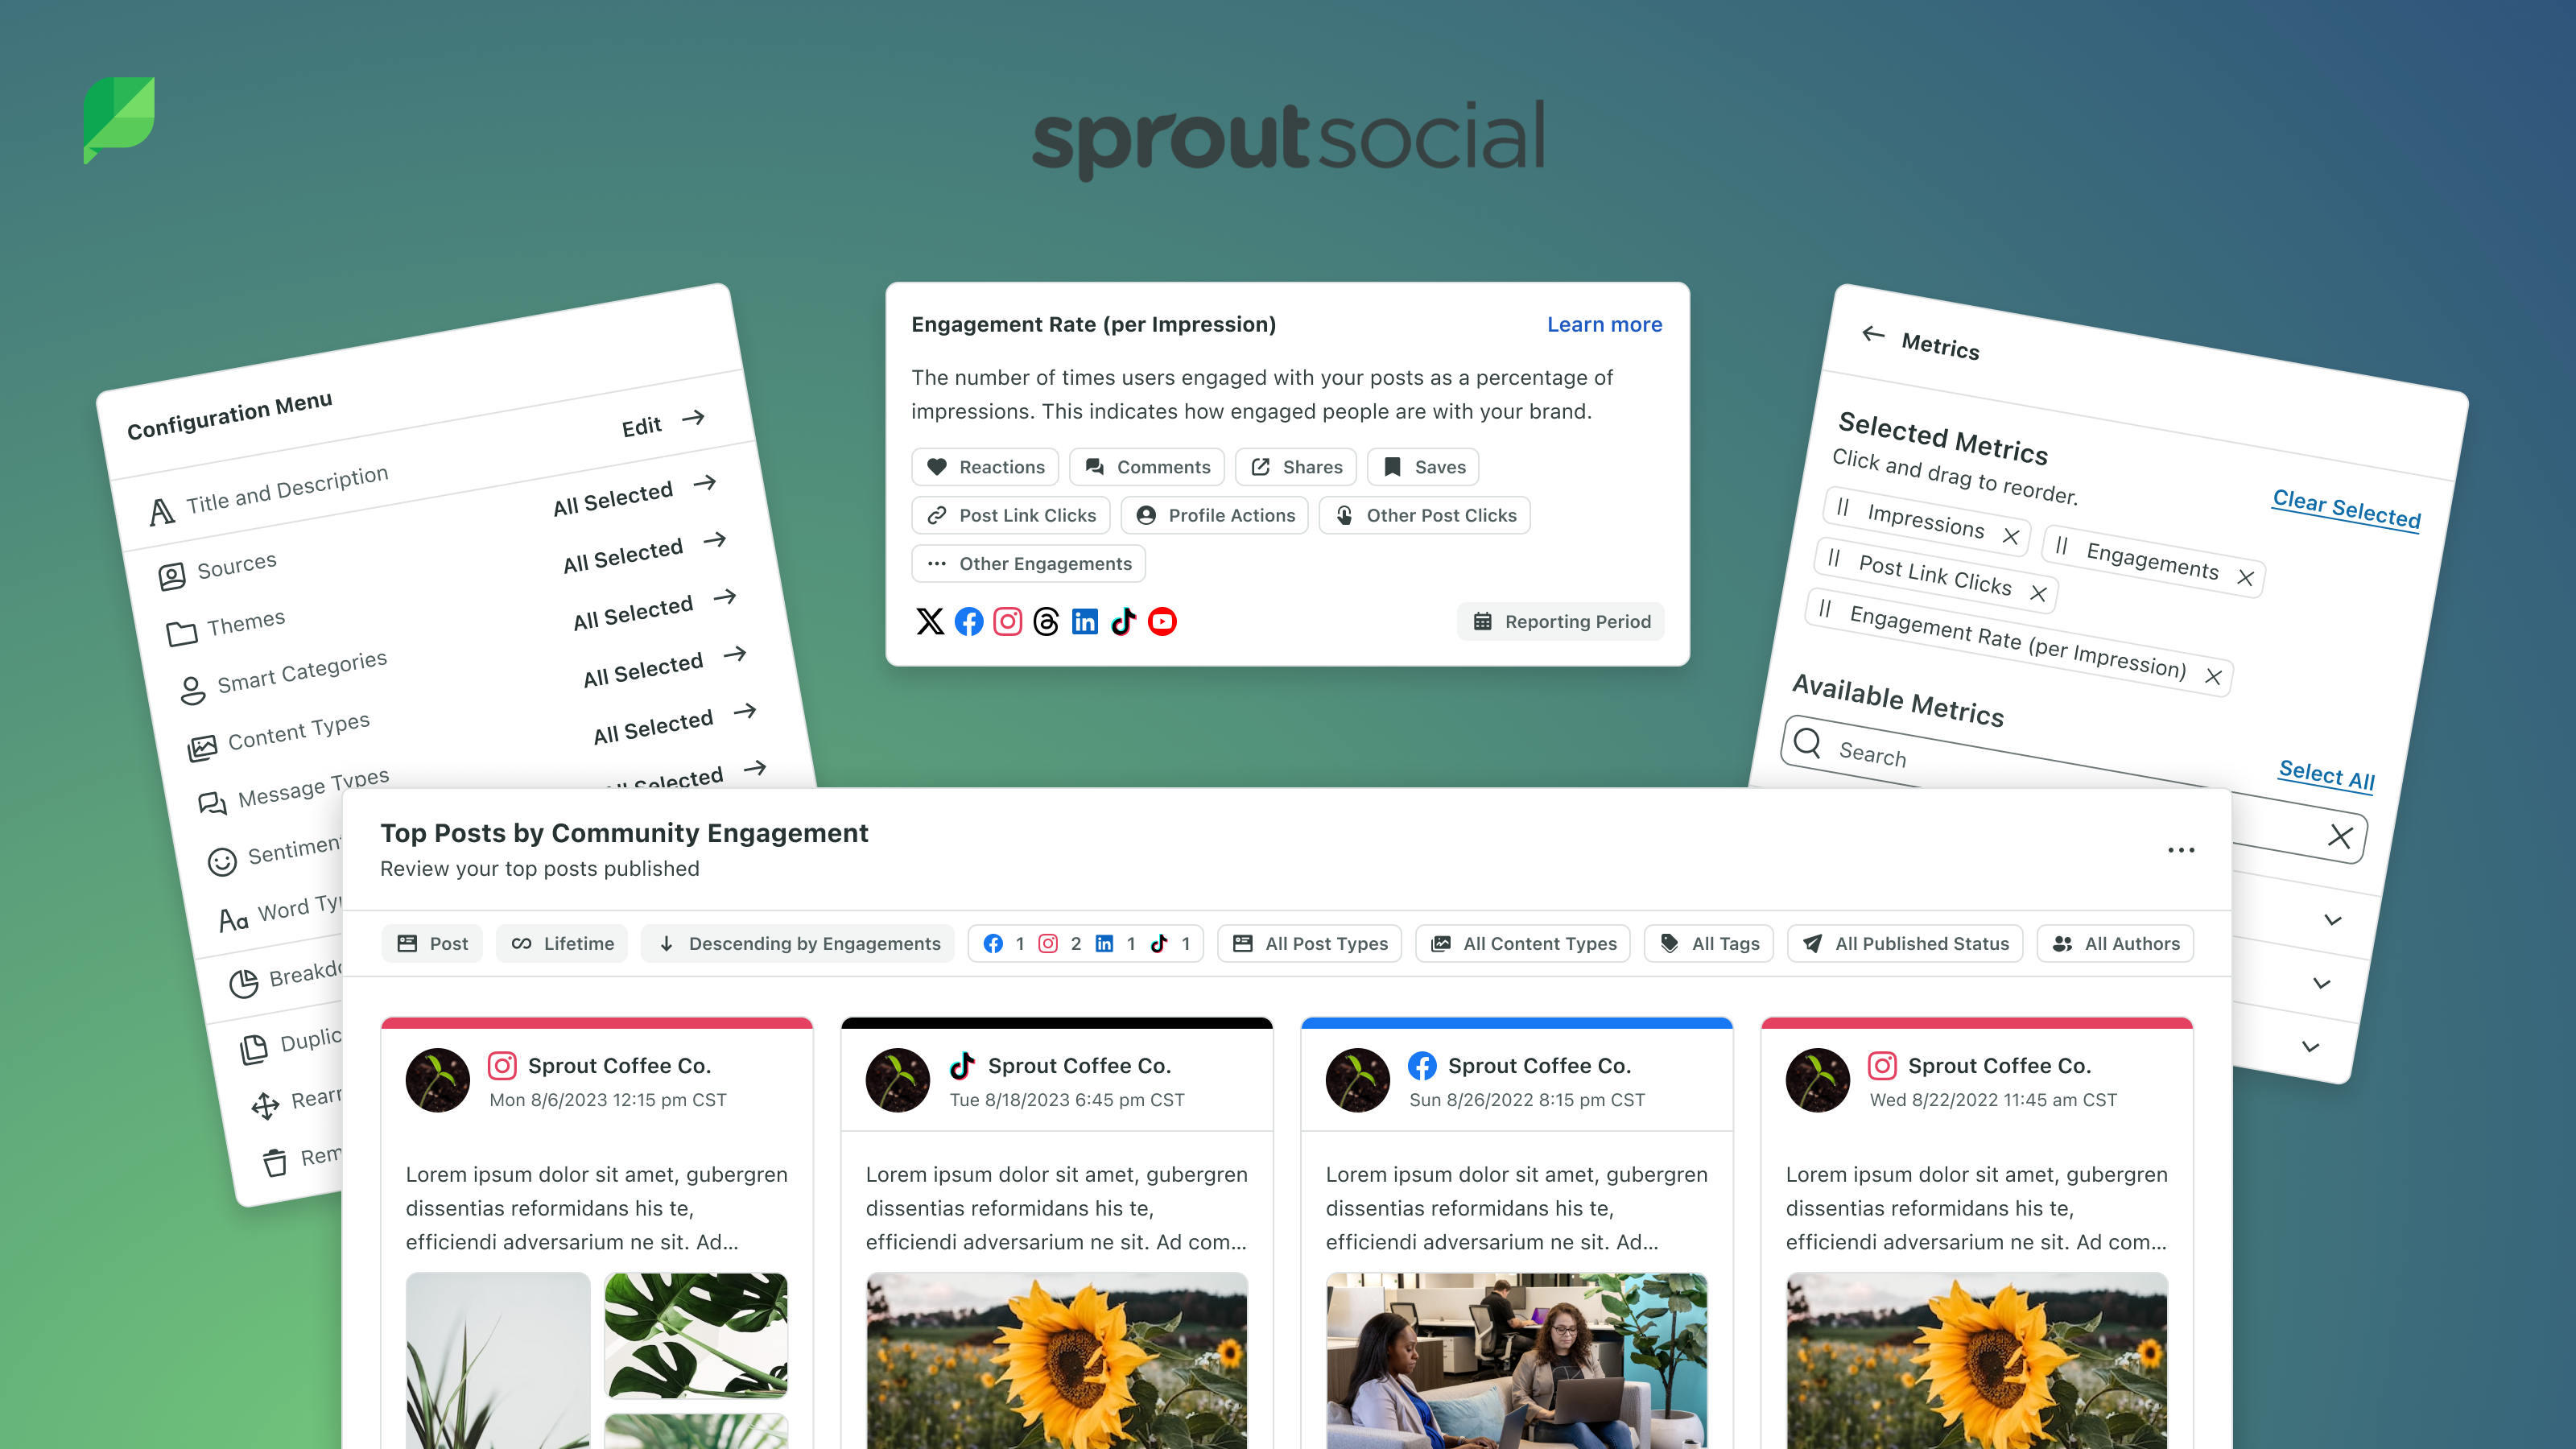
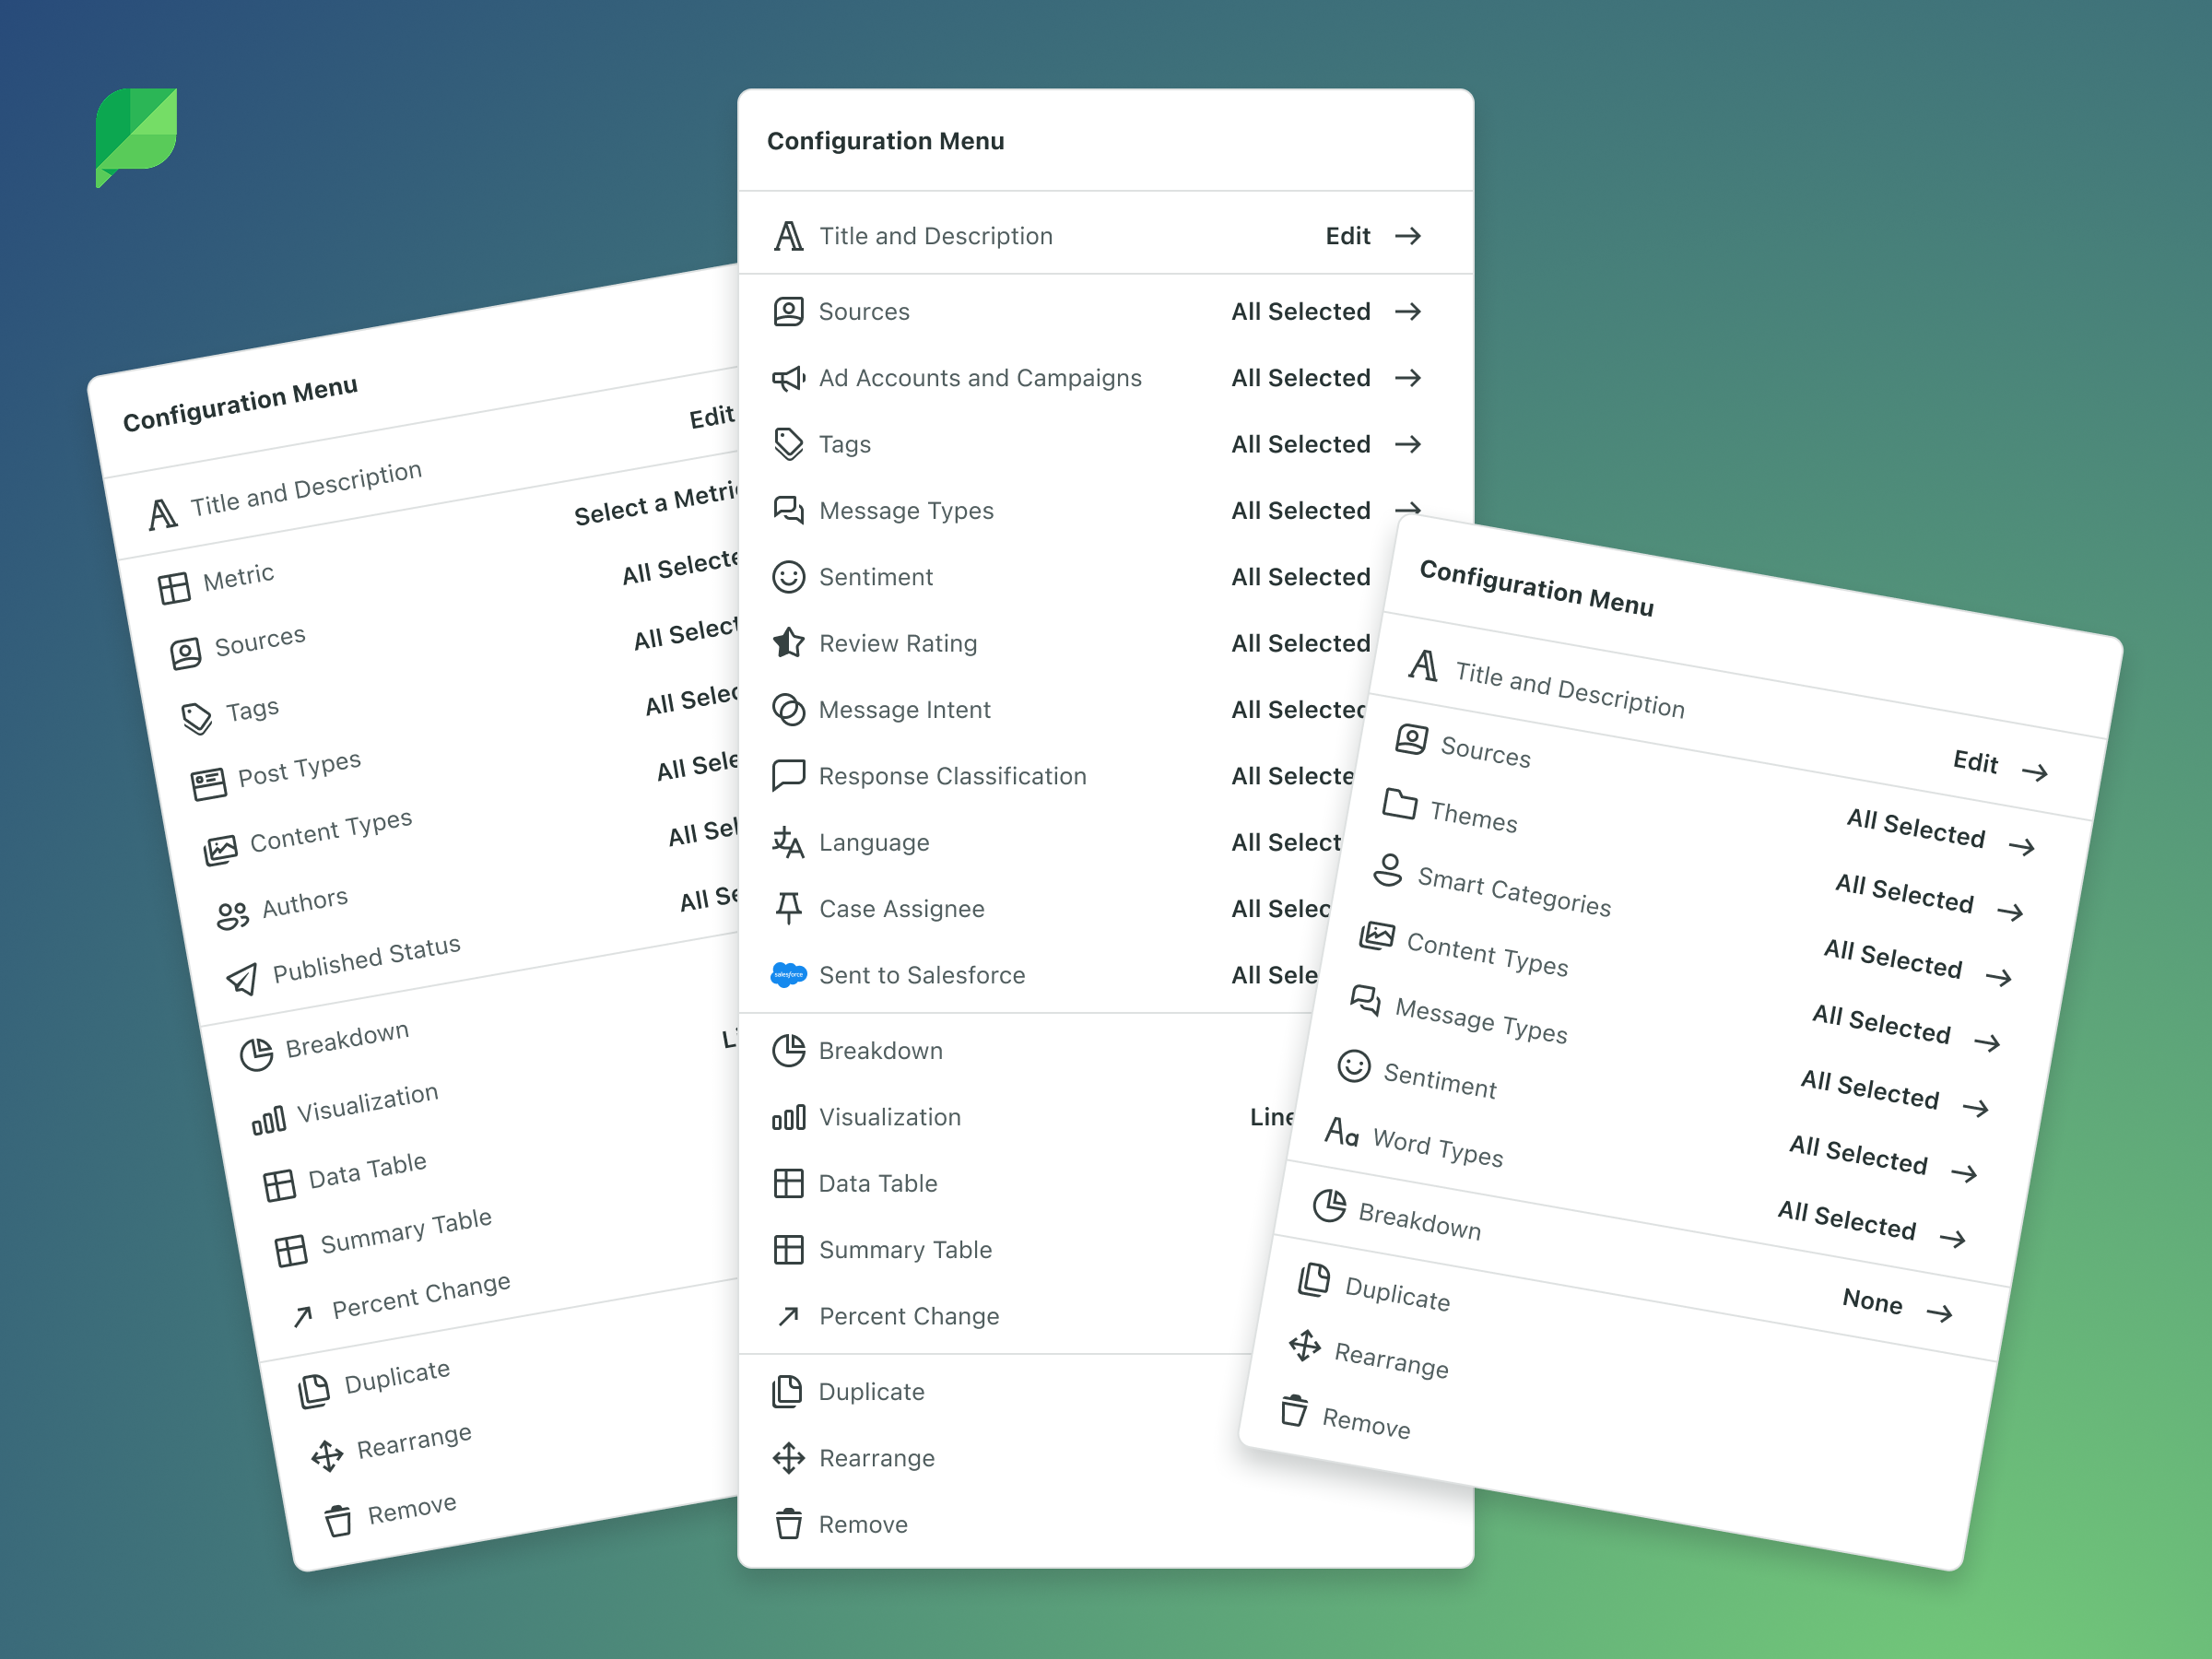
I designed a universal menu component that could flex to accommodate any combination of functionality a widget might need: filters (profiles, tags, campaigns, listening topics, content types, etc), configuration (metrics selection, aggregation and breakdown options), and display settings (chart type, table inclusion, percentage change, etc).
The component used a consistent interaction pattern regardless of which widget it was attached to, keeping the learning curve flat even as we scaled to new widget types over time.
This was built in Figma using auto-layout, variants, and variables so that the component could be configured per widget type while maintaining a single source of truth. When engineering needed to add a new widget category later, the pattern was already established and could be leveraged to spin it up with little upfront effort.
Widget-Level and Bulk Filtering
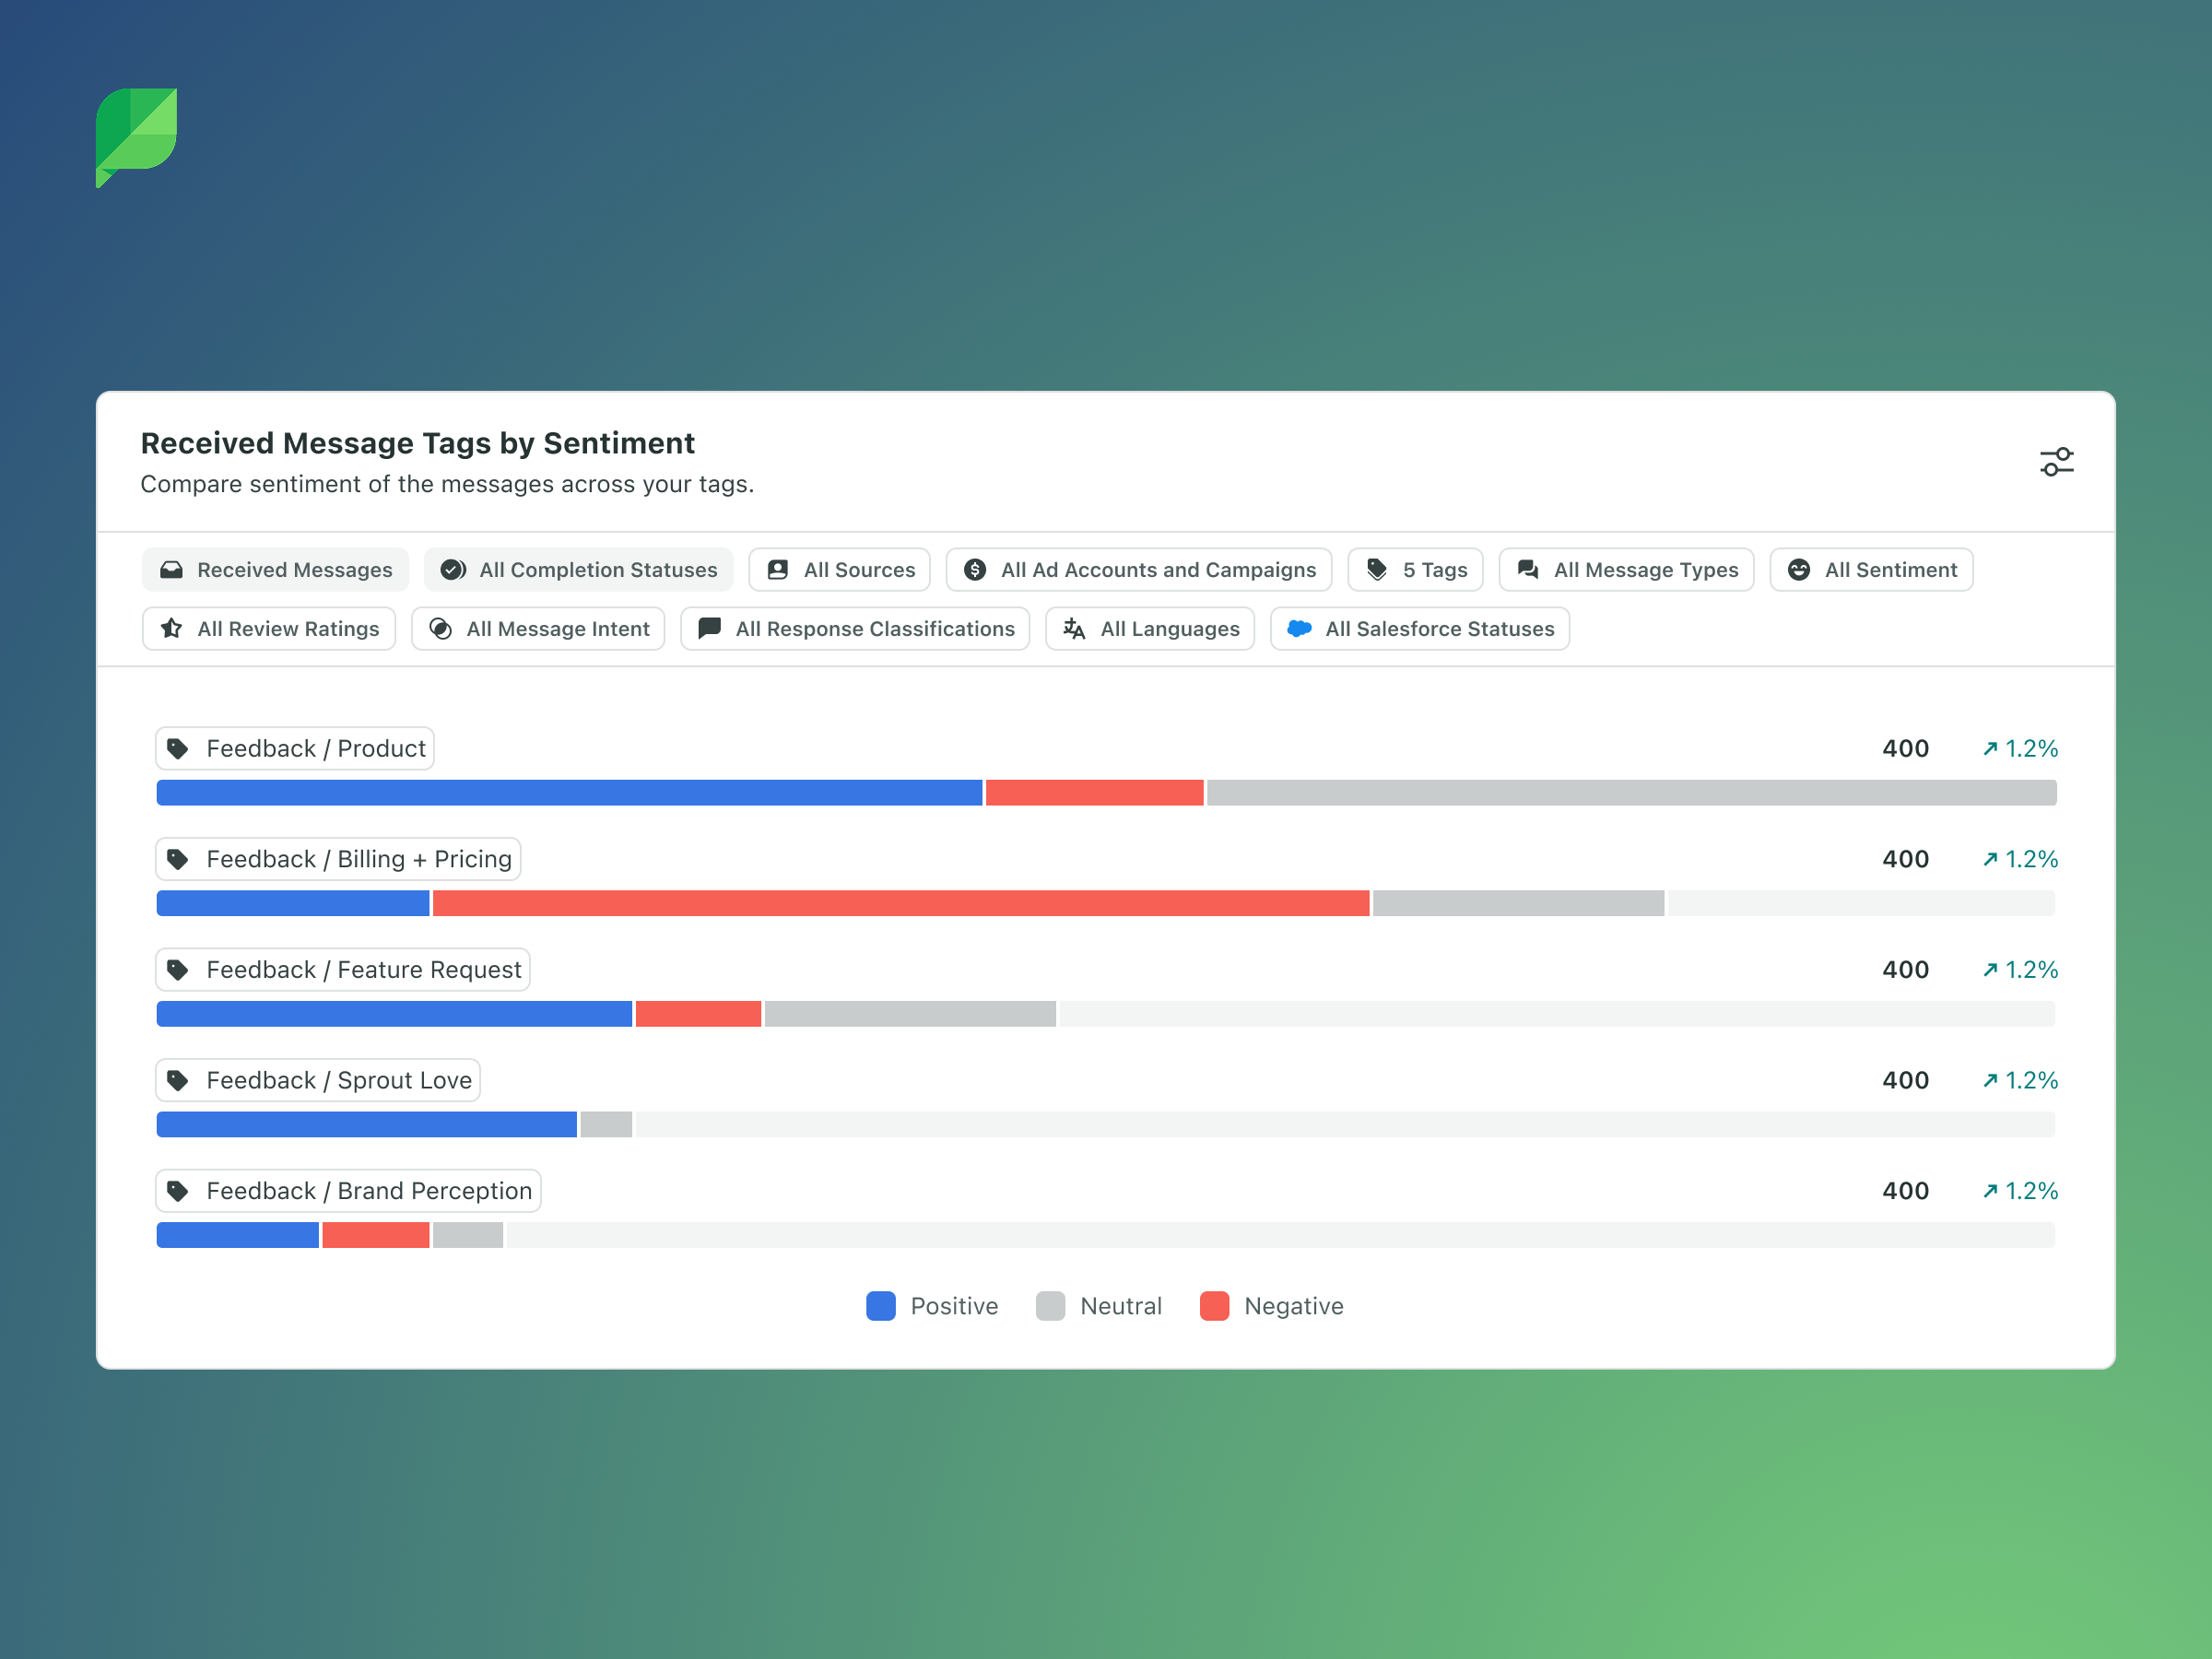
The core interaction model shifted filters from the top of the report to the individual widget. For visibility, each widget now displayed its own filter tokens. These are small, visible indicators of which profiles, tags, campaigns, or other filter dimensions were selected for that specific widget.
Filters were now saved to the report rather than to each user, so what all users collaboratively configured was displayed uniformly to all users. This meant that the intent of the report was preserved across all viewers.
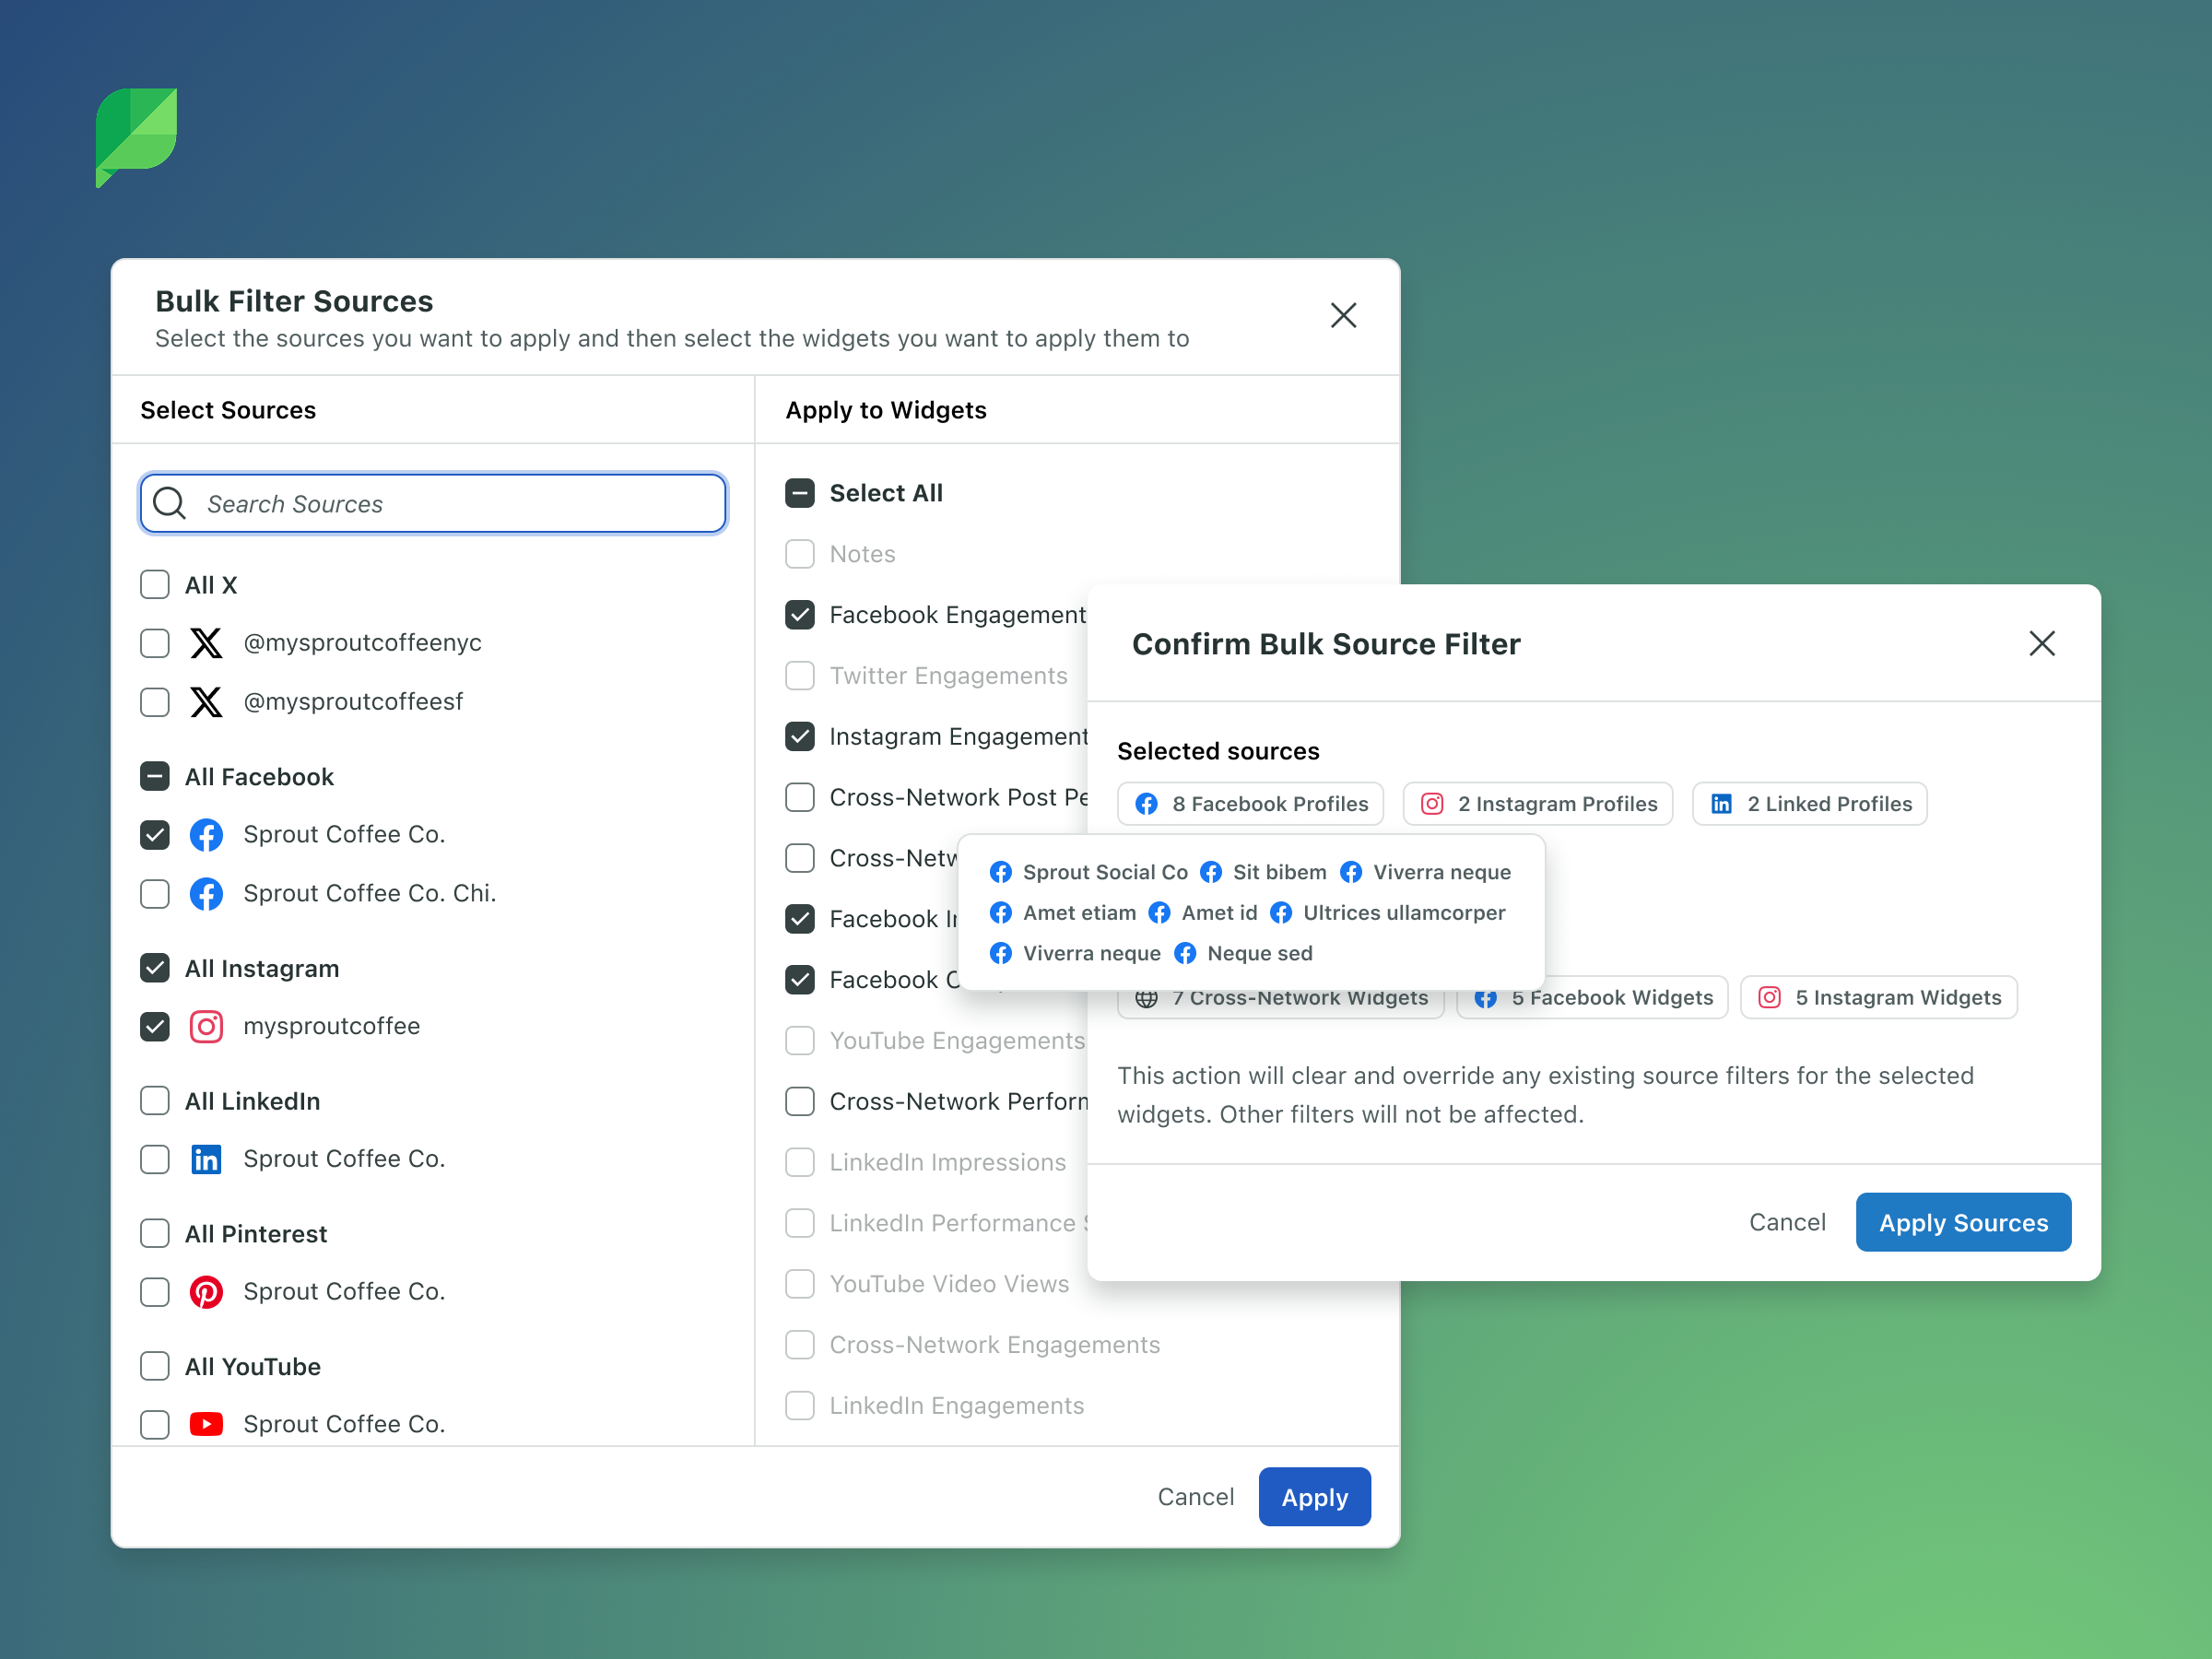
We learned from the results of ther research that many users still needed the ability to apply a filter across all or multiple widgets at once. An agency building a monthly report with 15 widgets for a single client shouldn't need to manually set the same profile filter 15 times.
Rather than forcing a choice between paradigms, we designed a bulk filtering capability that allowed users to select multiple widgets (or the entire report) and apply a source filter to all of them simultaneously. This became the bridge between the old mental model and the new one. Users who were accustomed to report-level filtering had an efficient approach, while those who needed granularity could still configure widget by widget.
Annotations for Storytelling
Survey data had confirmed what the interviews had surfaced: reports weren't just data repositories. They were communication artifacts. Customers needed to explain why a metric spiked, provide executive summaries, call out campaign context, or add visual branding.
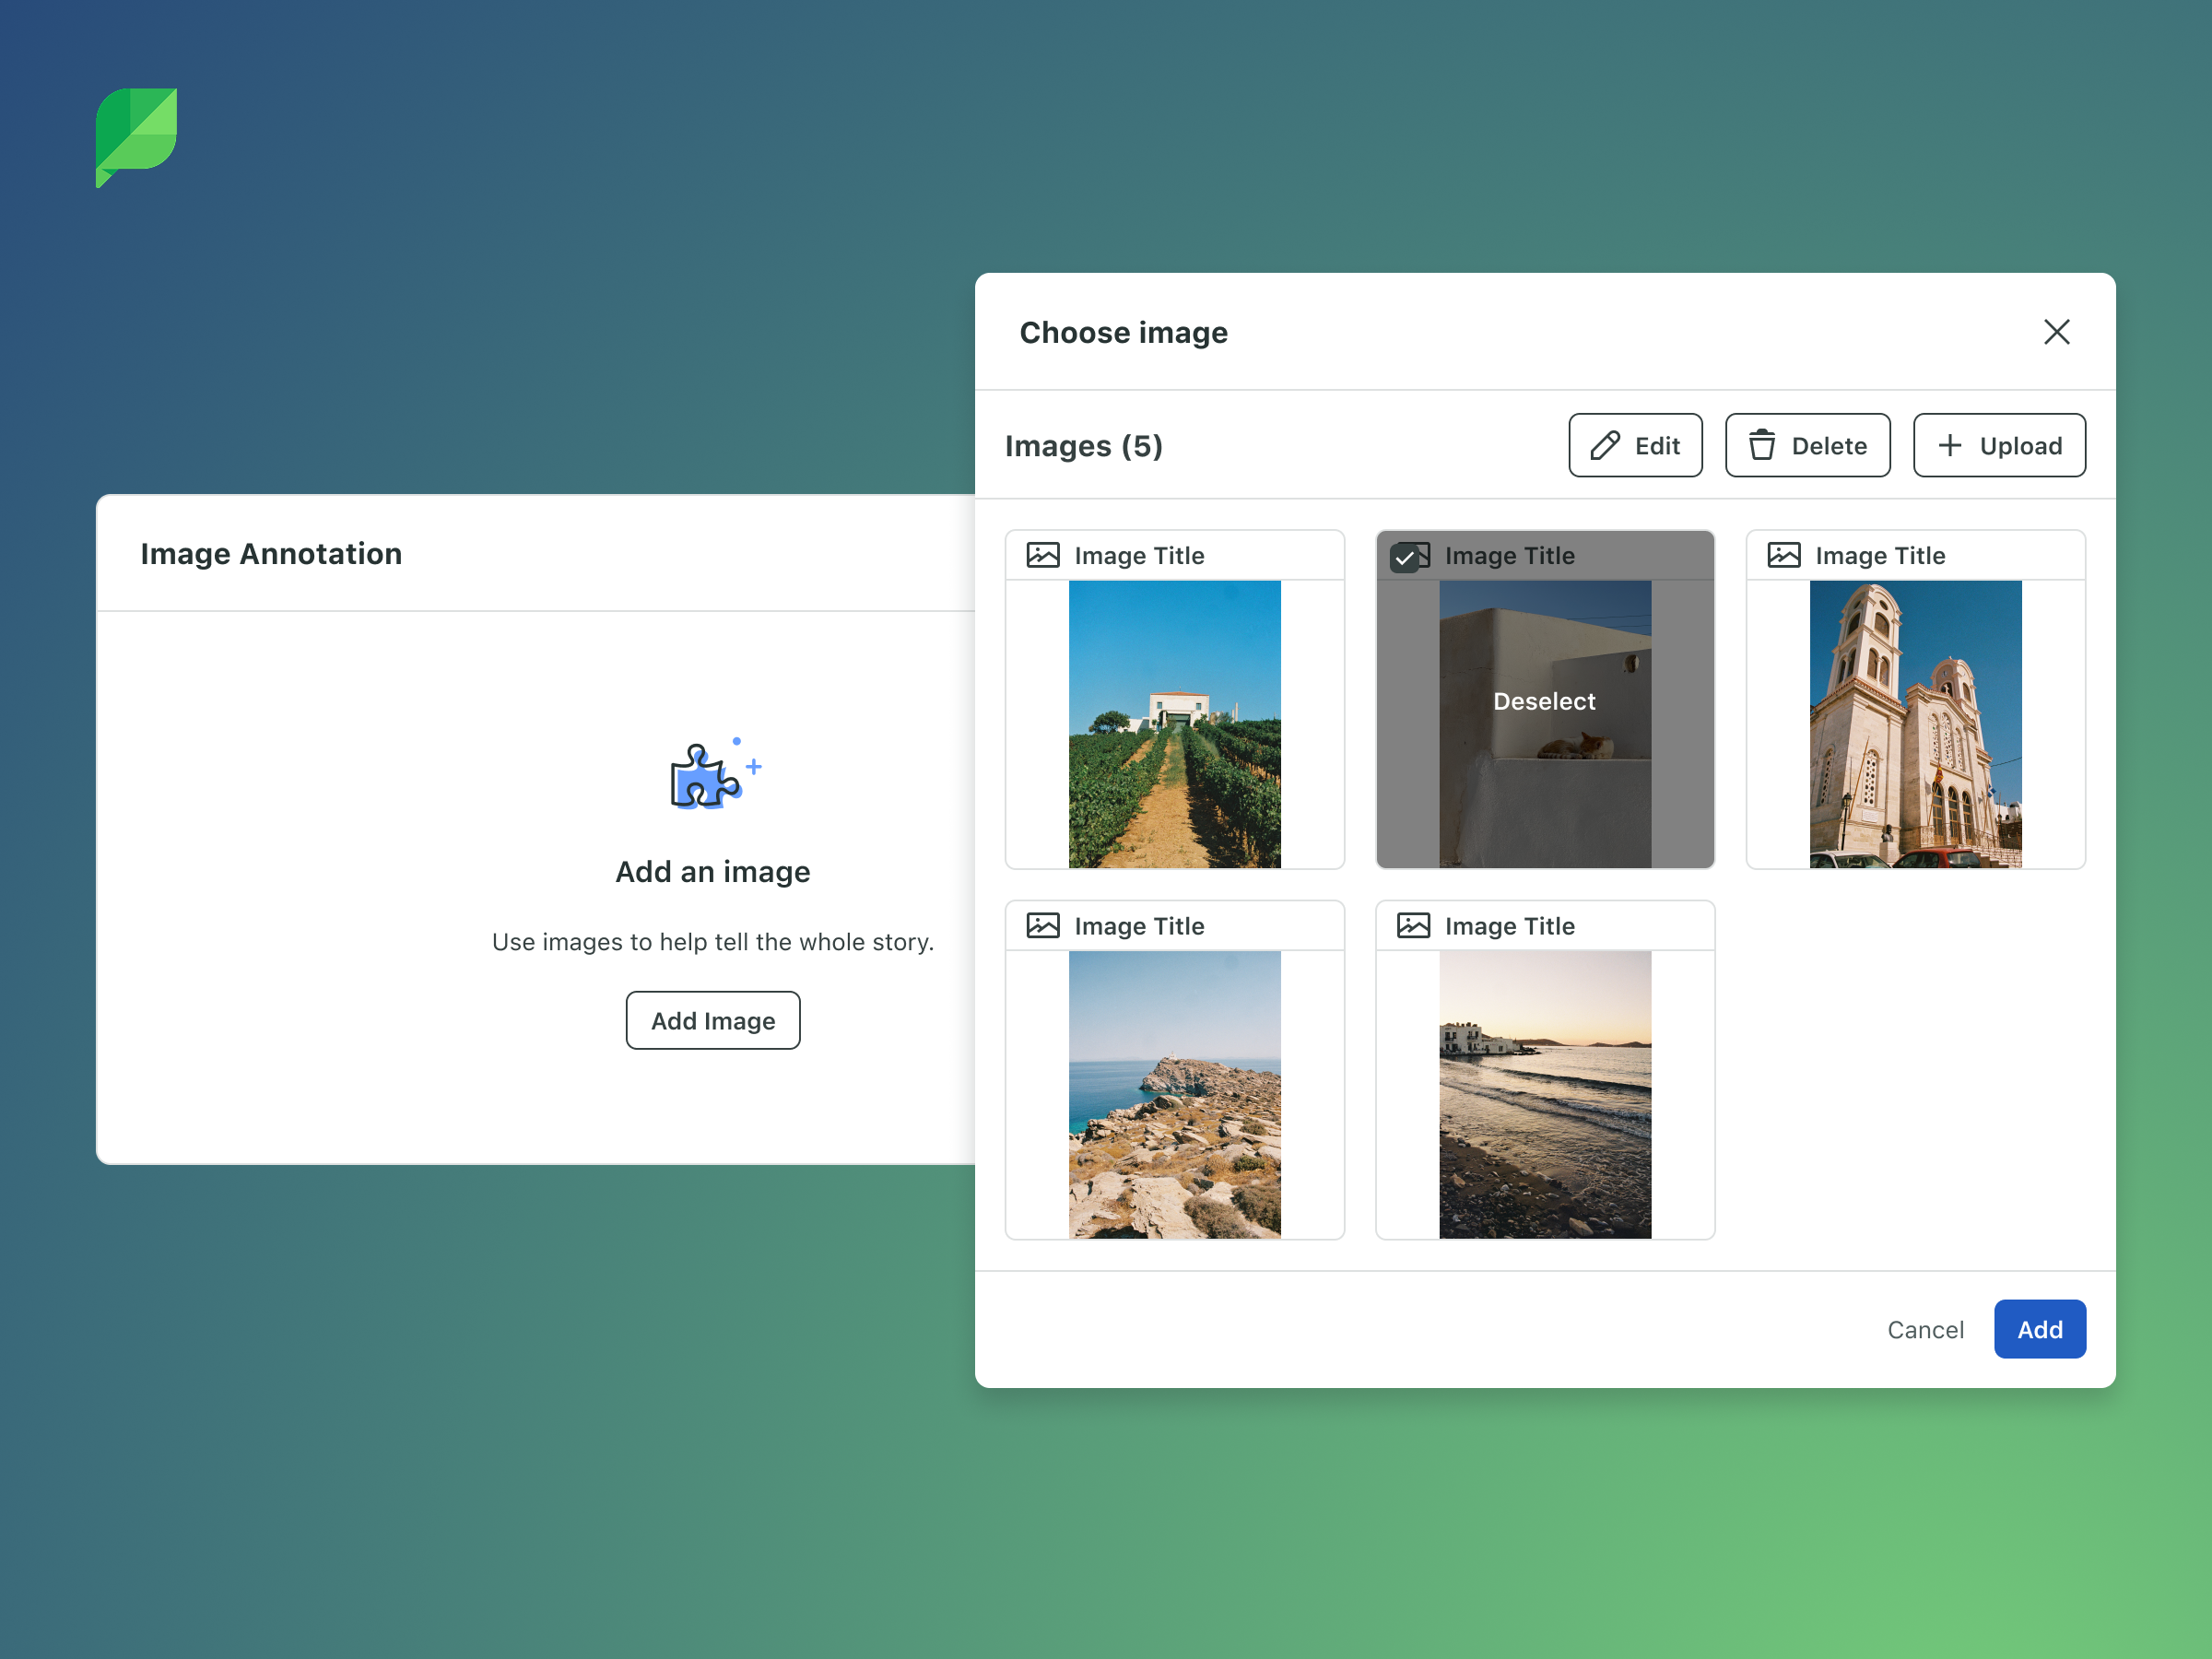
We introduced annotation widgets that allowed customers to add rich context directly within their reports. Text annotations (both manually and AI-generated summaries), image annotations, and the ability to rename widget titles and descriptions all contributed to transforming reports from data displays into narratives that could stand on their own when shared with stakeholders who weren't social media experts.
New Visualizations and the Charting Framework
Alongside the structural redesign, we transitioned to a new charting framework that expanded what was possible visually. This wasn't just a cosmetic upgrade, it enabled new visualization types, better support for multi-metric comparisons, accessibility improvements, and a more consistent rendering experience across the various export formats (PDFs and shared links) that customers depended on.
Removing Edit Mode
A secondary but meaningful improvement: the old system required users to enter an explicit "edit mode" to make changes, then save. In the new system, all changes (Adding a new widget, adjusting a filter or configuration, reordering the widgets, etc) were saved as they were made. This eliminated a friction point that had generated consistent confusion in customer interviews and reduced the risk of lost work.
The Migration
Building a better system was only half the challenge. The other half was getting thousands of our active users onto the new version without disruption. These customers have carefully constructed reports they'd built over months or years that we needed to maintain.
Phased Rollout
We structured the release in three phases:
Alpha: A small group of Premium Analytics customers received access to three of the most-used widget types (Top Posts, Performance Summary, Engagement) in a temporary, intentionally limited report. The goal was to get the new widget interaction model into real hands for feedback before building the full infrastructure. Pendo notifications guided users to the experience and solicited structured feedback.
Beta: A broader group gained access to the new reporting page with the 90th-percentile widgets and full export capabilities (PDF, CSV, shared links, scheduled deliveries). Remaining widgets were released incrementally as they were built. Users could opt in to migrate their existing reports during this phase.
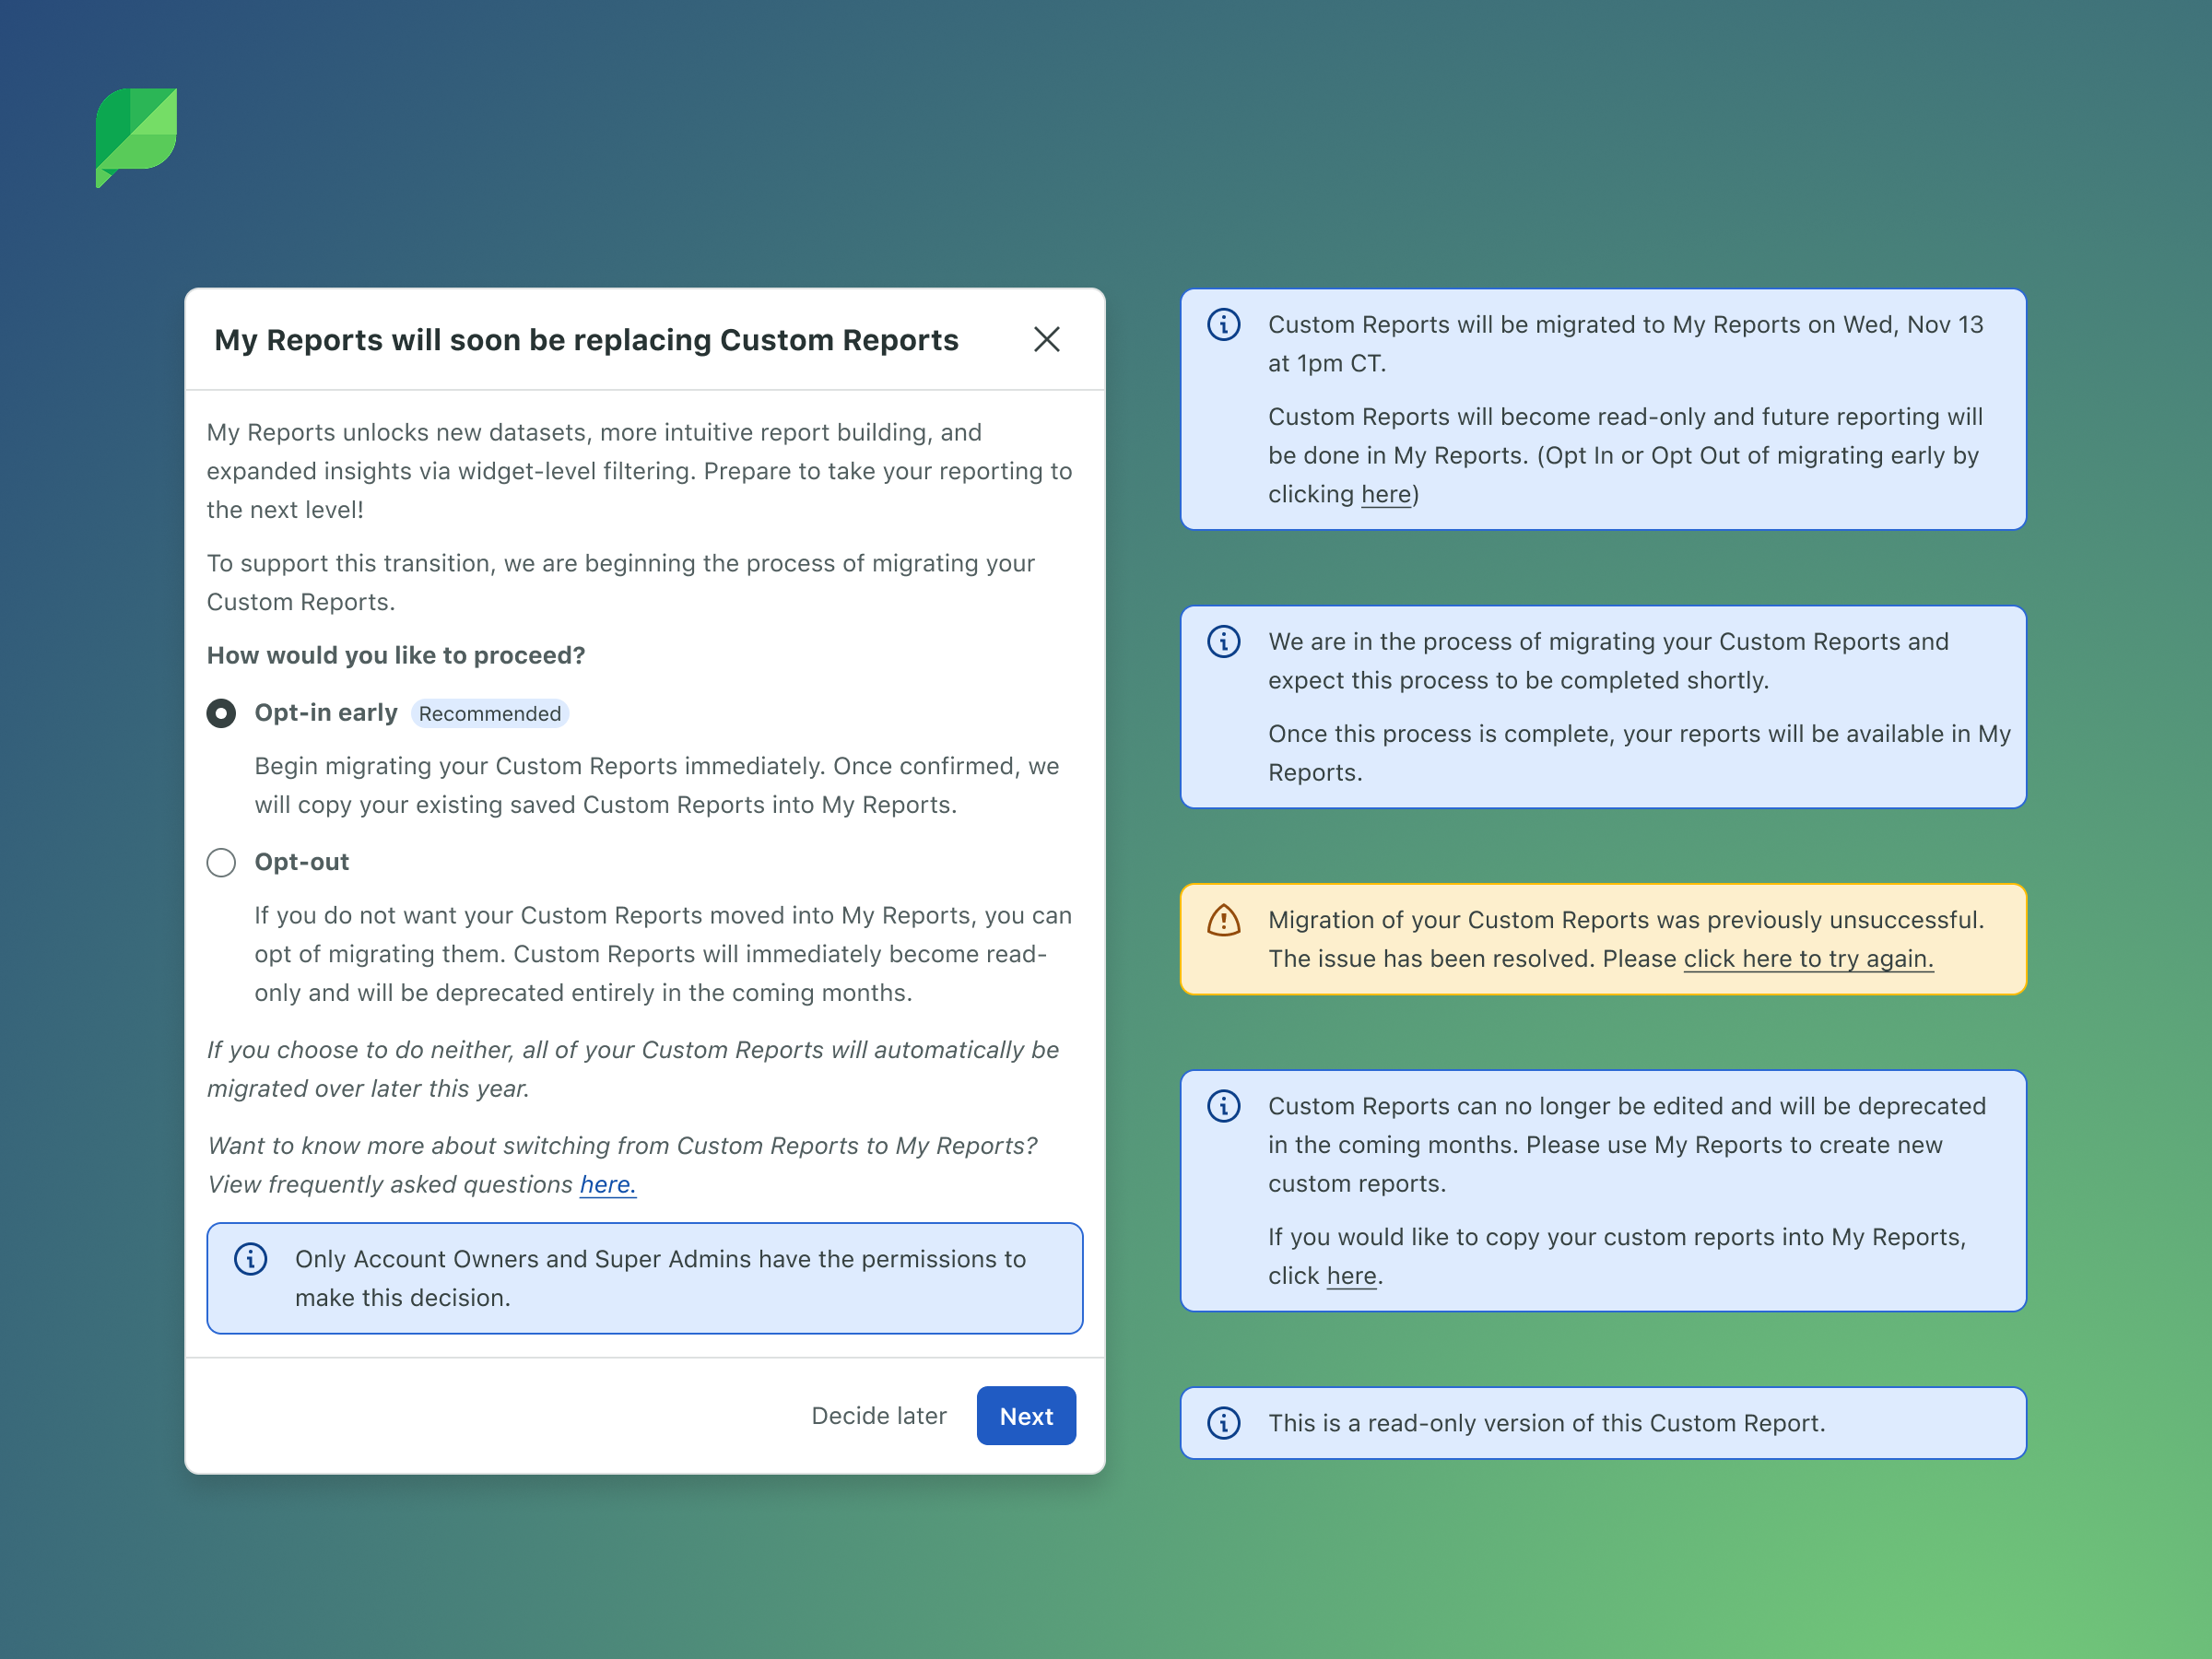
General Availability: All customers gained access. A clear timeline (approximately 3 months) gave users time to voluntarily migrate their reports. When a user opted in, all of their active reports were automatically moved to the new system with equivalent consolidated widgets replacing the old ones. Users who didn't opt in by the deadline were migrated automatically, with advance notification that user-level filters would be reset.
Education and Communication
Migration design often gets overlooked because it's unglamorous work. But for a product where customers have active data, making sure the transition is intuitive, clear and successful is critical.
We designed education touchpoints at multiple stages: in-app banners explaining the transition timeline, modal walkthroughs when users first encountered the new experience, contextual guidance around the shift from report-level to widget-level filtering, and clear messaging about what would and wouldn't be preserved during migration.
Supporting Two Systems Simultaneously
During the transition period, both the old and the new Custom Reports existed in the product simultaneously. This meant engineering needed to maintain feature parity for any updates that came from other teams. If another squad shipped a change that affected reporting widgets, it had to be reflected in both systems until the old one was deprecated.
From a design perspective, this dual-world constraint influenced every decision. New patterns couldn't create confusion for users who were still in the old system. Navigation needed to accommodate both without implying one was broken or inferior. And the migration prompt needed to feel encouraging rather than coercive.
Technical Collaboration
This project required close partnership with engineering at every stage. The decision to build a new system rather than retrofit the old one was driven as much by technical constraints as by user needs. The existing API structure and front-end architecture weren't designed for widget-level filter persistence.
I participated in technical discussions around the new API scaffolding, filter data models, and the charting framework transition. Understanding the architecture directly informed design decisions about what could ship incrementally versus what needed to land together, and it helped me scope the alpha and beta experiences realistically.
The new Platform API structure was designed with future extensibility in mind, including endpoints that would support reporting within the mobile app, and the upcoming features on the roadmap like data-dense dashboards, tabs, drag-and-drop, folder organization, and more.
Outcome
The new My Reports experience rolled out to all of Sprout Social's Premium Analytics customers. The new architecture has continued to absorb new widget types without requiring new patterns. Each new addition leverages the universal widget component and filter system designed at the outset.
The reception has been overwhelmingly positive, with customers appreciating the improved performance and flexibility.
We have continued to layer additional features onto the experience including Custom Metrics, improvements to Scheduled Report delivery and more.
Building for the Future
One of the things I'm most proud of about this project is what we unblocked for the future of Sprout Reporting.
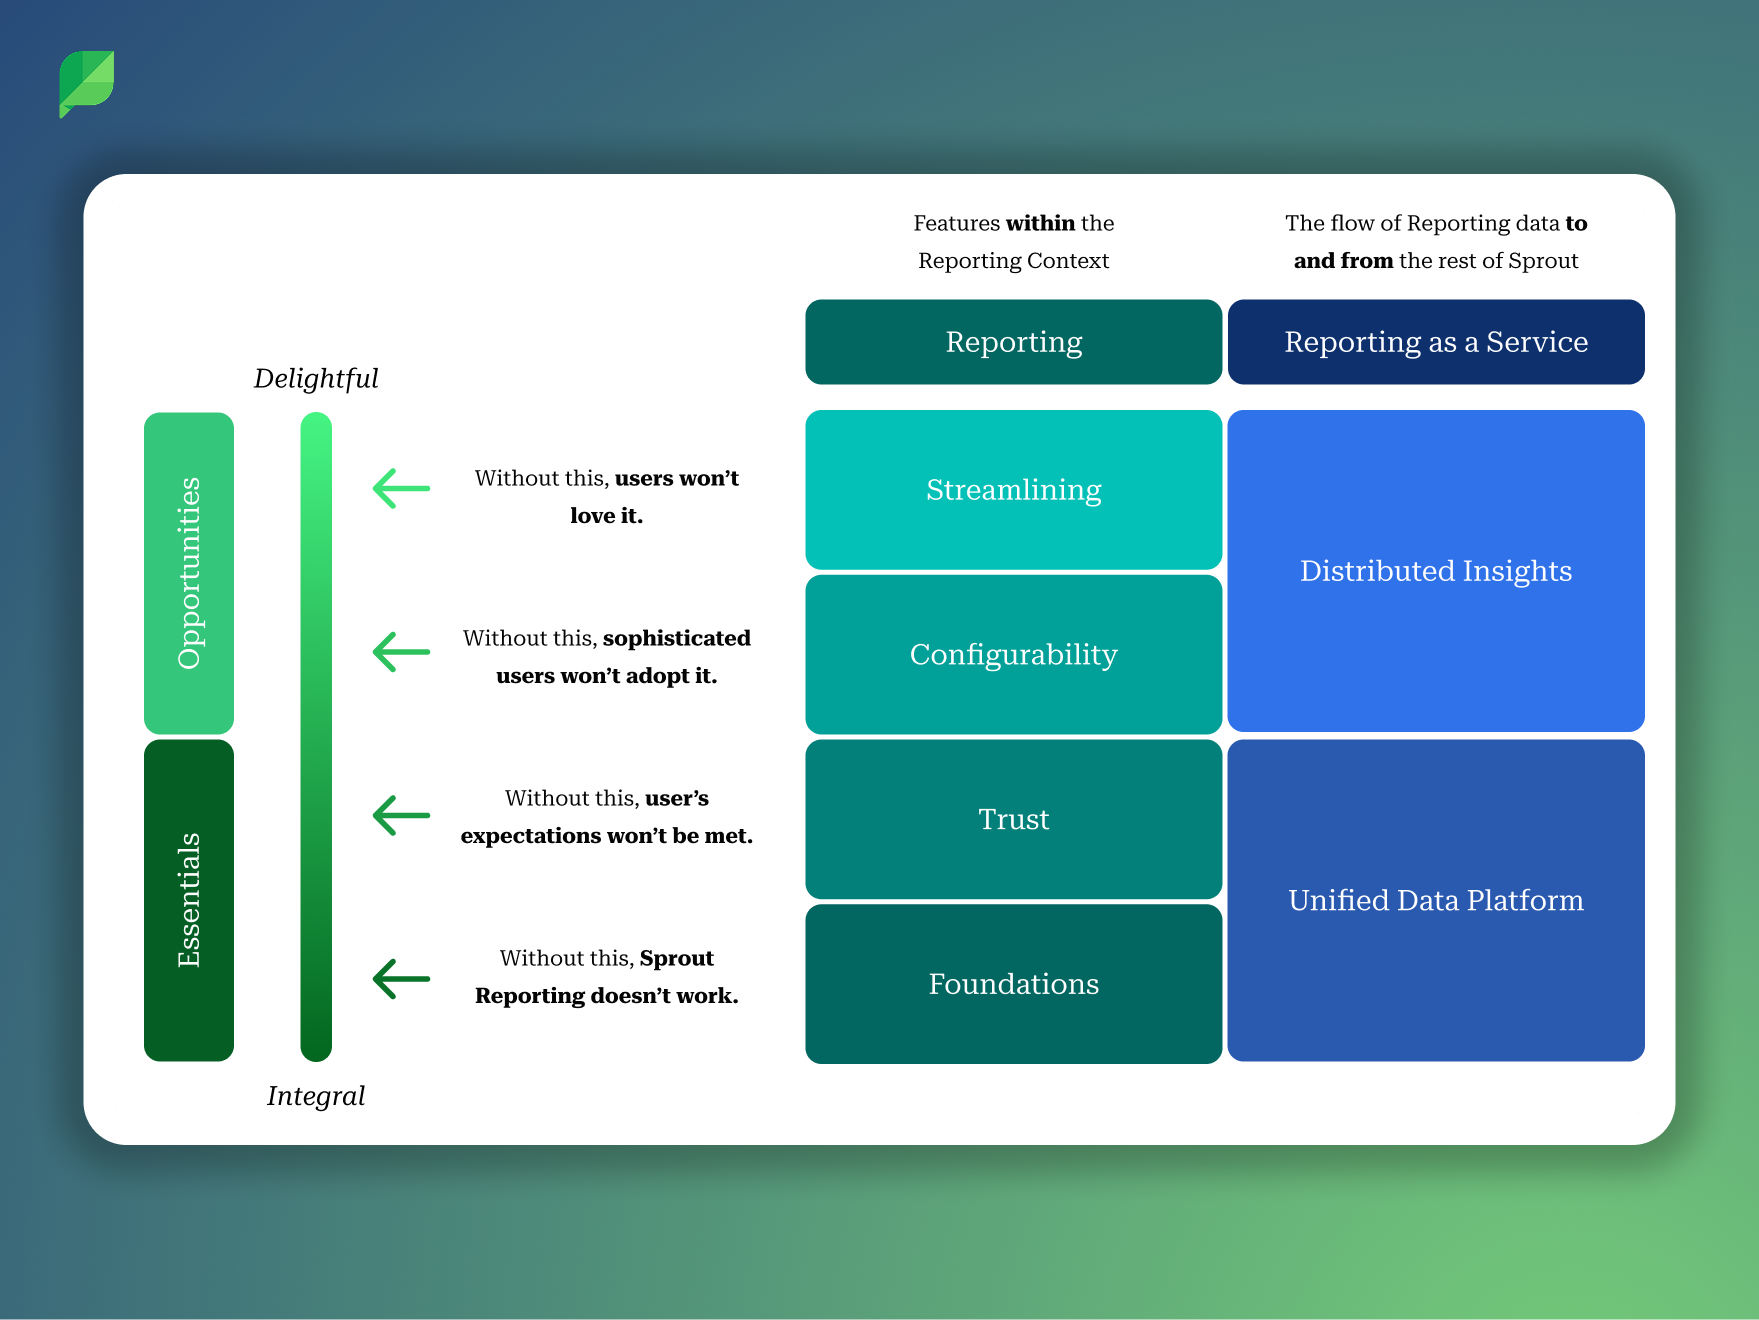
The reporting framework was never conceived as a standalone feature. From the earliest conversations, we designed the architecture with the understanding that it would need to serve as the foundation for a much broader evolution of Sprout's reporting capabilities. After the GA release, I helped author a strategy review that articulated this vision and made the case for continued investment. That document organized the future of Sprout Reporting around two categories that I think are useful for understanding the scope of what we built:
The Essentials represented the foundational layers of trust, accuracy, network parity, and scalability. Sprout's reporting had historically focused on meeting customer expectations around network data, but shifting metrics and API deprecations across social platforms were creating inconsistencies that eroded confidence. The new platform architecture gave us a more agile foundation for responding to these changes, reducing the lag between a network API modification and data availability in reporting.
The Opportunities represented how the framework we'd built could evolve to meet the growing sophistication of enterprise customers. The scalable UI patterns we created for widget configuration were explicitly designed to absorb future capabilities without requiring structural redesign. Features like widget-level date ranges, custom metric calculations, dynamic responsive layouts, were all on the roadmap, and all were now technically feasible because of the architectural decisions made during this project.
Reflection
If I could revisit one thing, I'd push harder on investing in report templates. Research consistently showed that many customers don't necesarily know what is best to put in a custom report and a stronger template foundation at launch would have shortened the time-to-value for less sophisticated users.
That said, looking back on this project, I'm extremely proud of the team and what we were able to accomplish together. I know that I couldn't have done it without collaborating closely with my product and engineering partners.
These are the sort of situations that I thrive in. I find comfort and satisfaction in reducing the complexity into something simple.